
Direct vs Regular Mutual Funds: 10-Year Cost-Adjusted Performance Analysis
- Ayesha Bee
- Jul 1, 2025
- 5 min read

Updated: Jul 4, 2025
Disclaimer
This blog is for educational purposes only and should not be considered financial advice. Mutual fund investments are subject to market risk. Please consult a SEBI-registered advisor before investing.
Introduction
If you've ever sat down to pick a mutual fund and ended up more confused than when you started, you’re not alone. You see a bunch of funds with the same name, but then there’s ‘Direct’, ‘Regular’, ‘Growth’, and something called ‘IDCW’ tagged on. At that point, you’re just staring at the screen, wondering if any of this even matters.
Well, it does. But don’t worry, in this blog, we’re going to break it all down in the simplest way possible. No heavy jargon, no extra layers, just clear, straightforward explanations that actually make sense.
Differences Between Direct and Regular Plans
The Main Difference: Commission
In a Direct Plan, you invest directly with the AMC (mutual fund company) through their website or approved direct platforms.
➤ No intermediary = No commission
➤ Hence, lower expense ratio and better returns over time
In a Regular Plan, your investment goes through an agent, bank RM, or platform.
➤ They receive a commission from the AMC
➤ This cost is built into your expense ratio, so it’s higher
➤ You’re paying extra for advice, convenience, and handholding
NAV Difference: Direct NAV is Higher
NAV (Net Asset Value) is the price of one unit of a mutual fund.
The underlying portfolio is the same for both Direct and Regular plans, but:
➤ Direct Plan NAV is always higher
➤ Regular Plan NAV is lower
Returns: Direct Gives Better Returns in the Long Run
➤Direct Plans have lower expenses; they typically deliver slightly higher returns than Regular Plans.
➤The difference might seem small (like 0.5% to 1% annually), but over 10–15 years, it can add up to lakhs of rupees due to compounding.
Example: If you invest ₹5 lakhs for 15 years:
Direct Plan at 12% = ₹24.7 lakhs
Regular Plan at 11% = ₹22.4 lakhs, That’s a ₹2.3 lakh difference—just because of commissions!
Service: Ongoing Service vs Self-Management
➤ Regular Plan = Service Included like Portfolio tracking, Asset allocation advice, Tax-saving suggestions & help with transactions and KYC. This is ideal if you are a beginner.
➤ Direct Plan = DIY Mode; You manage everything yourself.
What is Option Type in Mutual Funds? (Growth vs IDCW)
Once you’ve selected your fund (Direct or Regular), the next step is to choose the option type — this determines how you receive the returns.
You’ll usually see two options:
Growth Option
IDCW Option (Income Distribution cum Capital Withdrawal — formerly called Dividend
Yes — Option Type is Available in Both Direct and Regular Plans
Growth vs IDCW – What's the Difference?
Growth Option
∙ The mutual fund does not pay out any income or profit to you during the investment period.
∙ All the returns are reinvested back into the fund.
∙ Your money compounds over time, leading to higher wealth creation.
∙ You only get your gains when you sell/redeem the fund.
✅ Best for: Long-term investors, goal-based investing, wealth creation
✅ Tax-efficient, as you don’t receive periodic income
IDCW Option (Dividend)
∙ The fund pays out a portion of profits from time to time, either as cash or credited to your bank account.
∙ Every time an IDCW is paid, the NAV drops by that amount.
∙ Your money does not compound fully because part of the returns are being withdrawn.
✅ Best for: Investors looking for regular income (like retirees)
Methodology: How We Compared 10-Year Returns
1. Fund Selection
We randomly selected 6 large-cap mutual funds for comparison.
Aditya Birla Sun Life Frontline Equity Fund
Tata Large Cap Fund
Axis Large Cap Fund
HDFC Large Cap Fund
HSBC Large Cap Fund
ICICI Prudential Large Cap Fund
2. Time Period
We analyzed data over a 10-year period to capture long-term performance.
3. Plan Type
Both Direct and Regular plans were considered, but only the Growth option was used to keep returns comparable.
4. Data Sources
All information was taken from:
∙ Official fund house websites
∙ AMFI (Association of Mutual Funds in India) website
6. Assumed Investment for Comparison
To show the impact of TER on actual investor returns, we assumed an initial investment of ₹1,00,000 made in 2015 in both Direct and Regular plans of each fund. We then calculated the final corpus in 2025 using their respective 10-year CAGR values.
5. Metrics Used
We evaluated each fund using these three metrics:
CAGR (Compound Annual Growth Rate): The average annual return of the investment over 10 years.
TER (Total Expense Ratio): The annual fee charged by the fund, expressed as a percentage of the fund’s assets.
Effective Return: Calculated as CAGR – TER, showing the approximate net return for the investor.
Performance analysis
CAGR (Compound Annual Growth Rate)
This chart shows the 10-year performance of each fund for both Direct and Regular plans.

Direct plans consistently outperform Regular plans across all six funds.
The difference in CAGR ranges from 0.68% to 1.2%, which is significant over a 10-year period.
Total Expense Ratio (TER)
This chart shows how much each fund charges annually to manage your investment.

∙Regular plans have a significantly higher TER due to distributor/agent commissions.
∙Direct plans have much lower TER, sometimes less than half of their Regular counterparts.
End Corpus (Direct vs Regular)
This chart displays the final value (corpus) of ₹1,00,000 invested in each fund (Growth option) over 10 years (2015–2025):

Across all six funds, the Direct plan corpus is consistently higher than the Regular plan.
The gap is clearly visible and reflects how small annual differences in CAGR and TER compound significantly over time.
For example:
ICICI Prudential Direct: ~₹3.72 lakh vs Regular: ~₹3.28 lakh
Tata Direct: ~₹3.17 lakh vs Regular: ~₹2.57 lakh
This means investors in Regular plans end up with ₹40K–₹60K less despite starting with the same investment.
Corpus Comparison (Commission Paid): Regular Vs Direct Mutual Funds
This chart quantifies the extra amount lost in Regular plans, which effectively represents the commissions/intermediary costs paid over 10 years.
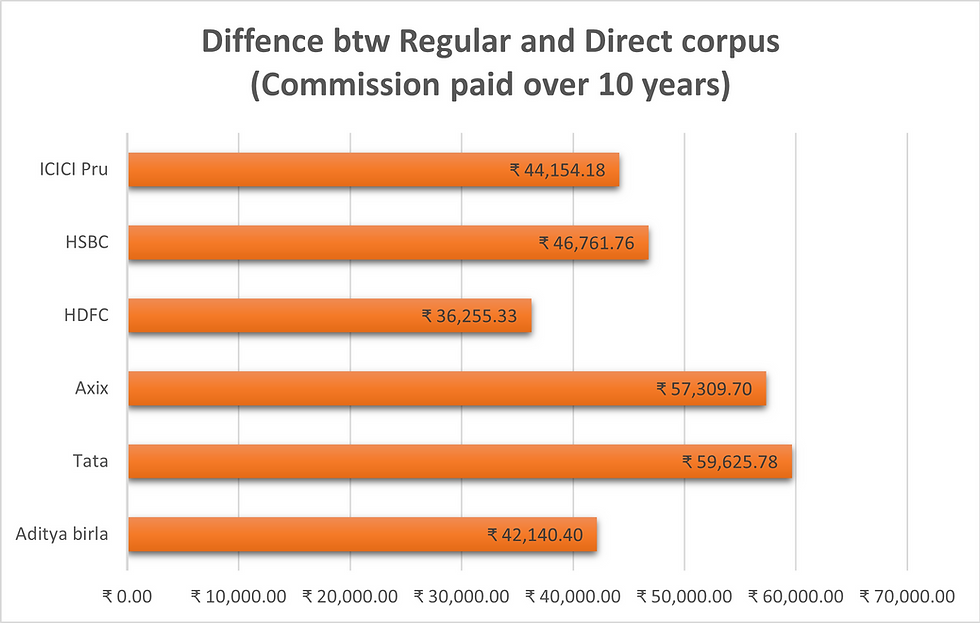
Mutual Fund shows the highest gap at ₹59,625.78, followed closely by Axis and HSBC.
HDFC shows the lowest gap at ₹36,255.33 — still a significant erosion of returns.
These values show how choosing Regular over Direct plans can cost investors ₹40,000–₹60,000 per ₹1 lakh invested over a 10-year horizon.
When scaled up to higher investments (e.g., ₹10 lakhs), the difference becomes ₹4–6 lakhs, which could have been retained simply by choosing the Direct plan.
Conclusion
Our analysis of six large-cap mutual funds over a 10-year period reveals a consistent difference in returns between Direct and Regular plans, largely driven by the difference in Total Expense Ratios (TERs).
Direct plans, with their lower TERs, generally resulted in higher end corpus values for the same initial investment. This is because they eliminate distributor commissions, making them more cost-efficient over the long term.
However, Regular plans offer value in the form of personalized guidance, ongoing support, and advisory services, which can be beneficial, especially for new or less confident investors who may find it challenging to select or manage funds on their own.
In summary:
Direct plans may offer higher returns but require investors to be proactive and informed.
Regular plans provide professional support, which may justify the higher cost for some investors.


I understand Return performance lower in Regular plan due to expense
But commision paid only on NAV performance. If NAV higher. Higher the commission and vice versa
When commision payment is dynamic charges also should be dynamic
But your analysis skipped real time time actual charges borne by regular plan to Scheme performance
I believe higher the AUM lower the expense vice versa
But real time expense charges factored in NAV. Not captured
If iam wrong correct me