


The Mechanics Of The Nifty Total Return Index In Mutual Funds

Reviewing an investment portfolio often involves looking at a final return percentage and assuming it represents the whole story. A critical component of wealth generation occurs silently behind the scenes through corporate dividends. Index values flashed on financial news networks exclusively track the rising and falling prices of stocks while ignoring the cash these companies distribute. Relying solely on price movements creates a structural gap when evaluating the true growth of capital.
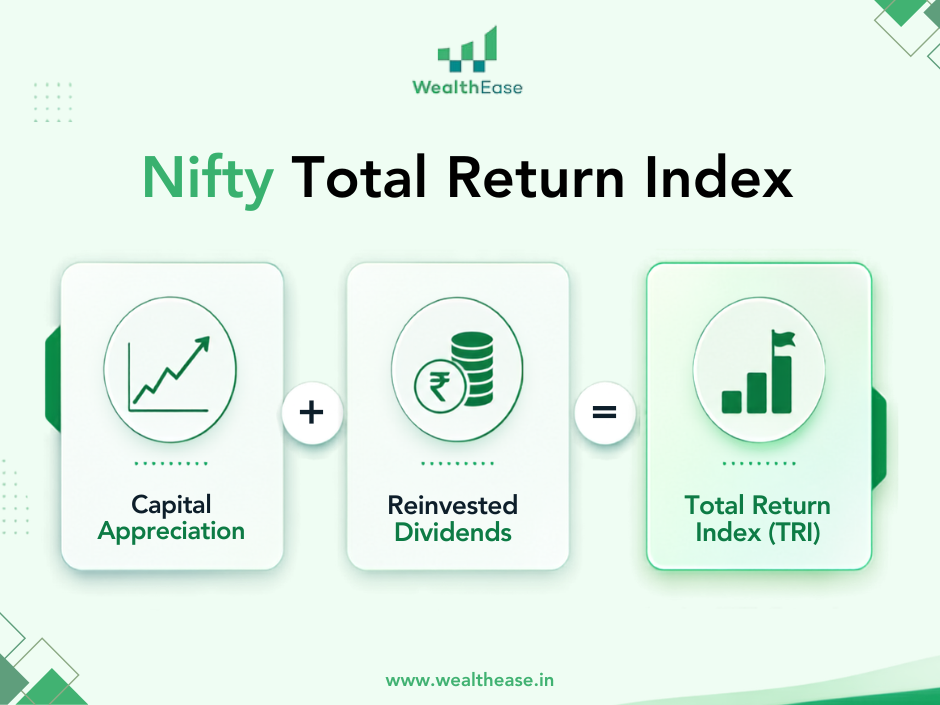
The nifty total return index bridges this gap by mathematically reinvesting every payout back into the market. Viewing mutual fund performance through this comprehensive metric provides the clarity needed to make precise, data-driven allocation decisions.
Key Takeaways
The Total Return Index (TRI) evaluates market performance by combining capital appreciation with the reinvestment of corporate dividends.
SEBI mandates this benchmark for mutual funds to ensure a transparent and mathematically accurate comparison of investment returns.
While TRI represents a highly precise standard, the calculation assumes frictionless reinvestment without accounting for real-world taxes or trading costs.
Mechanics Of The Nifty Total Return Index
The mathematical foundation of a total return benchmark requires continuous daily adjustments. The calculation ensures the index reflects the exact monetary value an investor would hold if all cash distributions were perfectly redeployed. This rigorous method applies across the market, whether analyzing broad indices or conducting a specific comparison like NIFTY 50 vs NIFTY Next 50 vs NIFTY 100 over long horizons.
Tracking closing valuations: The index provider calculates the daily capital appreciation or depreciation of all constituent stocks based on end-of-day market prices.
Aggregating corporate payouts: Any dividends declared by the underlying companies on that specific trading session are quantified.
Executing mathematical reinvestment: The index pushes the aggregate dividend cash back into the index constituents at current market valuations.
Updating the base divisor: The final index level adjusts to reflect both the capital movement and the newly acquired fractional shares from the reinvestment.
Comparing Price Returns And Total Returns
Evaluating performance metrics requires understanding exactly what variables the benchmark includes. A Price Return Index (PRI) only tracks the market capitalization changes of the underlying companies. The total return metric incorporates the compounding effect of corporate cash distributions, fundamentally altering the baseline for success.
Metric Feature | Price Return Index | Total Return Index |
Captures Price Fluctuations | Yes | Yes |
Includes Corporate Dividends | No | Yes |
Regulatory Benchmark Standard | No | Yes |
Representation of Growth | Partial | Comprehensive |
The mathematical divergence between these two metrics expands significantly over long holding periods. Reinvested dividends generate subsequent returns, accelerating the compounding trajectory of the benchmark. Grasping this structural difference is as fundamental to evaluating success as understanding Absolute Return vs CAGR vs XIRR when reviewing portfolio statements.
The Impact Of SEBI Benchmarking Regulations
India's market regulator instituted new benchmarking rules in 2018 to elevate transparency across the asset management industry. Prior industry standards allowed fund managers to benchmark dividend-reinvesting mutual funds against price-only indices. This structural imbalance made it mathematically easier for active funds to show excess returns.
Standardized Performance Evaluation The regulatory mandate forces mutual funds to align their return mechanics with the benchmark's return mechanics. Investors now evaluate performance on a transparent, level playing field.
Accurate Alpha Measurement Alpha represents the exact excess return generated by a manager above the benchmark. Switching to a total return standard recalibrates this alpha to reflect genuine investment skill rather than an incomplete calculation.
Enhanced Fund Selection Rigorous benchmarking allows capital allocators to clearly identify the funds that consistently navigate market cycles effectively.
Holding active managers to this standard ensures that wealth management strategies rely on objective, unvarnished data.
Recognizing Benchmark Limitations
The total return metric offers a highly realistic baseline, yet the calculation relies on specific structural assumptions. These theoretical conditions differ slightly from the friction-filled environment individual investors experience.
Frictionless Execution: The index reinvests dividends instantly without incurring brokerage commissions, impact costs, or settlement delays.
Tax Agnosticism: The mathematical model ignores all capital gains taxes and dividend distribution taxes that naturally drag on actual net returns.
Cost Exclusion: The benchmark operates without expense ratios or operational costs, which actively managed funds must overcome to generate alpha.
Understanding these limitations provides proper context when analyzing a fund's performance. Reviewing metrics like a fund's Portfolio Turnover Ratio alongside its total return benchmark offers a grounded approach to assessing execution efficiency and potential cost drags.
Before we conclude the blog, let us invite you for a 1:1 financial planning session.

Conclusion
Navigating financial markets demands precise measurement tools. Transitioning from price-based observations to total return benchmarking provides the clarity necessary to evaluate true capital compounding. Investors equipped with this standard can confidently separate market beta from genuine managerial skill. Implementing this rigorous approach ensures that portfolio allocations remain aligned with long-term wealth creation objectives.
FAQs
What exactly does a Total Return Index measure?
It measures the complete financial performance of a market basket. The calculation combines the daily price fluctuations of the underlying stocks with the mathematical reinvestment of all corporate dividends issued by those companies.
Why did regulators mandate TRI for mutual funds?
SEBI mandated this benchmark in 2018 to ensure fair, transparent performance comparisons. Comparing a dividend-reinvesting mutual fund against a price-only index created an unfair advantage, artificially inflating the fund's perceived success.
Does a total return benchmark make funds look worse?
The benchmark establishes a mathematically higher hurdle rate because it includes dividend compounding. Funds are not performing worse; the measurement standard is simply more accurate, requiring managers to demonstrate genuine stock-picking skill to generate alpha.


Comments