
ETF vs Index Funds: What's the Difference? Performance Analysis and Tracking Error
- Ayesha Bee
- Jul 24, 2025
- 6 min read

Summary
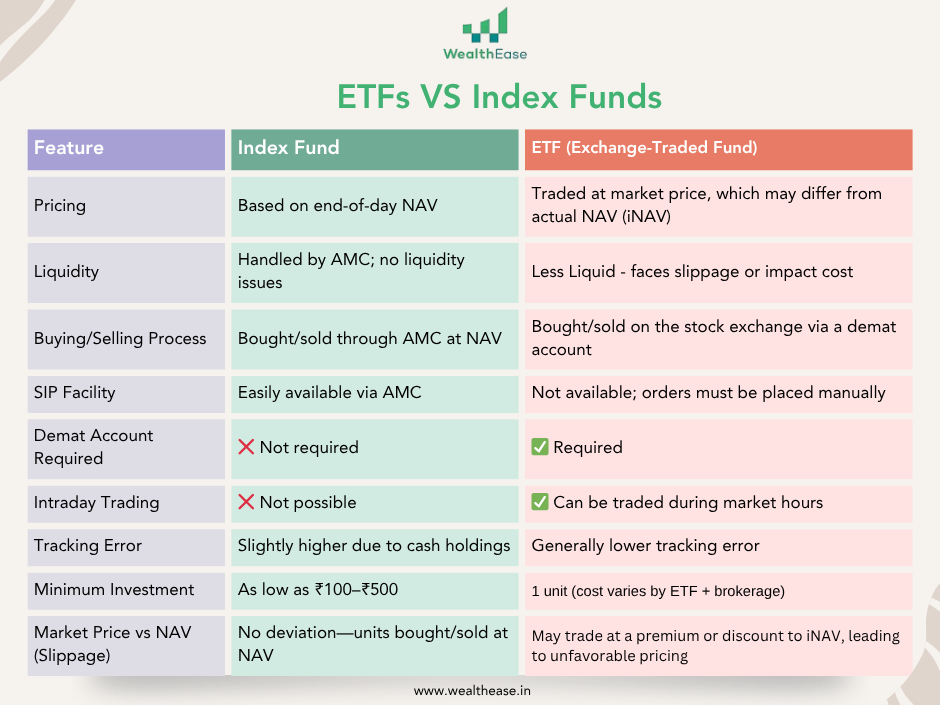
As passive investing gains popularity in India, investors often face the choice between Index Funds and Exchange-Traded Funds (ETFs)—two vehicles that aim to replicate market indices like the Nifty 50, Nifty Next 50, and Bank Nifty. While they serve a similar purpose, they differ significantly in structure, cost, liquidity, and performance delivery.
This blog explores those differences in detail and analyses how well these instruments have tracked their benchmarks over the past three years, using metrics like tracking error and 3-year CAGR.
Our data-driven analysis shows that while ETFs generally exhibit lower tracking error and more precise index replication, index funds offer greater simplicity and accessibility for everyday investors. All index funds studied underperformed their benchmarks to some extent, primarily due to expense ratios, cash drag, and rebalancing costs.
Whether you're a seasoned investor or a beginner, this guide created by a team of experienced mutual fund investment advisors will help you choose the right passive investment strategy based on your goals and constraints.
Introduction
Passive investing has gained significant traction in India over the past decade, offering investors a low-cost and relatively stress-free way to participate in the market. Among the most popular passive investment vehicles are Exchange-Traded Funds (ETFs) and Index Funds that were introduced in India around the 2000s.
Though both products serve a similar purpose, they differ in terms of structure, liquidity, cost, and how investors can access them. This comparison will help you understand which product may suit your investment style and goals better.
ETF vs Index Fund: Structural and Functional Differences
We all know what a mutual fund is—it’s a pool of money collected from many investors and managed by professionals. This money is then invested in a basket of assets like stocks, bonds, or other securities based on the fund’s objective. Mutual funds make it easier for individuals to invest in the markets without picking stocks themselves.
Now, mutual funds can be broadly divided into two categories:
1. Actively Managed Mutual Funds
Here, a fund manager makes regular decisions—buying and selling stocks with the aim of outperforming the market. These funds usually have higher fees because of the active research and trading involved.
2. Passively Managed Mutual Funds
These don’t try to beat the market—they simply aim to replicate the performance of a market index like the Nifty 50 or Sensex. These funds have lower costs because they just mirror the index.
A passively managed mutual fund is what we call an Index Fund.
So, What is an ETF?
An Exchange-Traded Fund (ETF) is also a type of passive investment vehicle, just like an index fund. It tracks an index, but with one key difference: it is traded on the stock exchange like a stock.
You can think of an ETF as a hybrid between a mutual fund and a stock

What is iNAV?
Like mutual funds have NAV, ETFs have iNAV, which stands for Indicative Net Asset Value.
It is the real-time estimate of an ETF's NAV (Net Asset Value) during market hours, and it gets updated every 2 minutes. Since ETFs trade like stocks throughout the day, investors need a benchmark to know whether the ETF’s market price is higher (premium) or lower (discount) than its actual value.
You can compare the market price of an ETF (Last traded price) with its iNAV to understand:
If it’s trading at a premium → Market Price > iNAV
If it’s trading at a discount → Market Price < iNAV
Slippage cost - When you place an order to buy or sell an ETF, you might not get the exact price you expect. That difference is called slippage, and the reason behind it is often the impact cost.
Impact Cost - This is the cost of your own trade moving the market. It usually happens with large orders or low-liquidity ETFs.
Example -
You want to buy 10,000 units of an ETF, but only 2,000 units are available at ₹100.
The remaining units get filled at higher prices (₹101, ₹102...). Your own buying pushed the price up → that's impact cost.
Main Expenses in ETF vs Index Fund

Performance analysis of Index funds and ETFs
To assess the effectiveness of passive investment vehicles, this section evaluates the recent performance of index funds and exchange-traded funds (ETFs). The analysis focuses on two key metrics:
The tracking error over the past year and the compound annual growth rate (CAGR) over a three-year period.
Due to the limited availability of 5-year return data for several index funds, the 3-year CAGR has been used as a consistent benchmark across all selected funds.
Tracking Error measures how closely a fund (like an ETF or index fund) follows the index it is supposed to replicate.
In simple terms, it tells you how much the fund's return deviates from the return of the index it’s tracking.
Methodology: Tracking Error Analysis of ETFs vs Index Funds
To analyze the tracking error of ETFs vs index funds in India, we followed a structured data-driven approach:
Data Source: We sourced the data from the AMFI (Association of Mutual Funds in India) website, by referring to the tracking error data published by AMCs and the scheme-wise performance details of mutual funds, where over 500 ETFs and index funds are listed with detailed information on benchmarks, returns, and tracking errors.
Filtering Criteria: We filtered for funds that benchmark Nifty 50, Nifty Next 50, and Bank Nifty—the most commonly tracked large-cap indices in India.
Tracking Error Data: We considered the 1-year tracking error disclosed by the AMCs (where available) as published on AMFI.
CAGR Data: We considered the Average 3-year CAGR as disclosed by the AMCs of all index funds, based on the index they track (where available), primarily sourced from AMFI.
Objective:
Tracking Error - The goal is to compare how well these funds replicate their respective indices, and whether ETFs consistently deliver lower tracking errors than index funds, as is often claimed.
CAGR Returns – The goal of analyzing the 3-year CAGR was to check how effectively the index funds and ETFs have replicated their respective benchmark indices over time.
Results
There were 500+ index funds and ETFs listed on the AMFI website. From these, we filtered only those funds that tracked the Nifty 50 TRI, Nifty Next 50 TRI, and Nifty Bank TRI benchmarks.
This gave us a focused dataset of 43 index funds and 37 ETFs for our tracking error analysis.
Index | Fund Type | Minimum TE (%) | Maximum TE (%) | Average TE (%) |
Nifty Bank TRI | Index Fund (7) | 0.04% | 0.08% | 0.06% |
| ETF (13) | 0.01% | 0.06% | 0.04% |
Nifty Next 50 TRI | Index Fund (11) | 0.01% | 0.39% | 0.21% |
| ETF (8) | 0.07% | 0.41% | 0.14% |
Nifty 50 TRI | Index Fund (25) | 0.02% | 0.23% | 0.09% |
| ETF (16) | 0.02% | 0.16% | 0.03% |
Based on the table, ETFs are more efficient in tracking their indices than index funds. However, this comes with the trade-off of demat requirements, brokerage costs, and liquidity risks, especially for retail investors.
3-year Performance of the index funds
All the index funds and ETFs analyzed have underperformed their respective benchmark indices, which aligns with the conventional expectation in passive investing. This underperformance can be attributed to factors such as expense ratios, tracking errors, cash drag, and delays in dividend reinvestment.
Even though Index Funds have a higher Tracking Error than ETFs across all indices, they have delivered consistently better 3-year returns (CAGR) than ETFs.
In conclusion, while all funds lagged behind their benchmarks, the extent of underperformance varied, with Nifty 50 funds being the most aligned and Nifty Next 50 funds showing the greatest tracking gap.

Disclaimer- Investments in mutual funds and exchange-traded funds (ETFs) are subject to market risks. Read all scheme-related documents carefully before investing. The information provided in this blog is for educational purposes only and should not be construed as investment advice or a recommendation. Past performance is not indicative of future results. Please consult your financial advisor before making any investment decisions. The author and the platform do not guarantee the accuracy or completeness of the information and shall not be held responsible for any losses incurred.


Comments